A tale of two lengths
Adventures in memory profiling a rust-based cacherust 2025-05-11
They say there are 2 hard problems in computer science, and I've hit all 3 of them.... This is a blog post about a memory problem we were hitting in production with a service written in rust, and the tools used to resolve it.
The Problem
Object Storage, whether S3 or something else, does not have the best performance for latency in comparison to local disk. There can be a lot of overhead to retrieving files. Alongside this, repetitive calls to the same files means that you will have multiple requests to the same data. One solution is to have a local cache of files sitting close to wherever you are using them. That way, for regularly requested files, you can reduce latency and decrease the amount of requests to the backing object store.
For a possible solution, we recently moved to using foyer, touted as a hybrid cache, as it provides not only a memory cache, but can be used with local disk storage as well. For really hot files, they would be served in memory. For colder files, they could be read from a local ephemeral ssd, so still providing some speedup even if evicted from memory. This looked like a great fit for our use case.
Things looked like they were going OK, until the cache had been running for a day or so. We noticed that the memory limits we were setting were not honoured, and we were seeing pod restarts with the reason set to OOMKilled. Something about how we configured the cache was not right.
Cache Layout
In our setup, we don't want to actually cache entire files, just the ranges of bytes that have been requested. Our request pattern means there is never any overlap between ranges, and the exact same ranges are going to be requested repeatedly.
So our Cache Key essentially looks like:
struct CacheKey {
    path: String,
    start: usize,
    end: usize,
}
And our Cache Value is standard Bytes, giving us a cache that looks a bit like this:
struct ByteCacheAppState {
    write_cache: HybridCache<CacheKey, Bytes>,
}
Of course with a cache we can't have unbounded memory usage. So we configure a weighter that uses the length of bytes in memory (plus a memory_size method for the key to account for the path string + two usizes, even if it's insignificant: we want to be as accurate as possible!):
...
.with_weighter(|key, value| key.memory_size() + value.len())
...
The Bytes struct is a bit of a special struct that is used in a lot of crates. It's essentially an Arc<[u8]> but has some magic to deal with other backing implementations. It's cheaply cloneable: the underlying memory isn't cloned, just a reference count is updated. You can also take a subslice into it as well, so that you can have a view into a portion of the backing bytes, without reallocating.
Byte Request
When we get a request for a range of bytes, we want to either return that ranges bytes if it's in the cache (either memory or disk), or read from object storage, storing that in the cache, and returning the bytes.
With foyer you can use the fetch method to do just that:
let cache_entry = write_cache
    .fetch(cache_key, || async move {
        let mut req = read_from_store(&path, range, &store).await?;

        let mut buffer = BytesMut::with_capacity(byte_len);

        while let Some(bytes) = req.stream.try_next().await? {
            buffer.extend_from_slice(&bytes);
        }

        Ok(bytes.freeze())
    })
    .await?;
And so our cache is pretty simple. We keep around slices of files that have been requested on the predicted chance that they will be requested again.
Troubleshooting
Since we were running into memory limit situations, we started troubleshooting what could possibly be wrong.
The first thing that we tried, was to reduce the limits that we gave to the cache to be much less than the memory limits of the pod, to see if it would plateau albeit at a higher limit. This seemed to have worked but was still a bit variable in our memory usage. And we still didn't know where the extra memory usage was coming from. We really needed to see what was going on with the heap.
One of the advantages of garbage collected languages is that you can really easily introspect the heap. For rust this was traditionally a bit harder. However, there are now some awesome tools we can use to investigate memory allocations. One we ended up using to troubleshoot was the jemalloc_pprof crate.
Profiling with jemalloc_pprof
One way to profile memory usage is to have jemalloc as the global allocator, set some settings to turn on profiling, and then use jemalloc_pprof to dump out the heap profile.
The cache is a simple axum webserver, so we ended up creating a request endpoint we could use to read the allocation profile when the cache was warmed up.
Here's how you can add this to your own project, if you wanted to follow along:
Firstly, add tikv-jemallocator and the jemalloc_pprof crate to Cargo.toml with a couple of enabled features:
tikv-jemallocator = { version = "0.6.0", features = ["profiling", "unprefixed_malloc_on_supported_platforms"] }
jemalloc_pprof = {version = "0.7.0", features = ["symbolize"]}
Secondly, enable this as the global allocator in main.rs, with some exported settings (see the jemalloc_pprof readme for an explanation):
#[global_allocator]
static GLOBAL: tikv_jemallocator::Jemalloc = tikv_jemallocator::Jemalloc;

#[allow(non_upper_case_globals)]
#[export_name = "malloc_conf"]
pub static malloc_conf: &[u8] = b"prof:true,prof_active:true,lg_prof_sample:19\0";
Thirdly, make a simple axum request handler to return the heap:
async fn get_heap() -> Result<Response<Body>, Error> {
    let mut prof_ctl = jemalloc_pprof::PROF_CTL.as_ref().unwrap().lock().await;

    let pprof = prof_ctl
        .dump_pprof()?;

    Ok(Response::builder().status(200).body(pprof.into())?)
}
Lastly, Run the program and get some allocations happening.
Getting Results
You can use curl to save the heap locally:
curl http://127.0.0.1:8000/path_to_get_heap > heap.pprofThen you can use pprof to serve the results as a webpage:
pprof -http=:8080 heap.pprofHeap Results
With the cache service instrumented, we ran up an instance with a limit of 10GB RAM for the cache. We then warmed the cache up to the point we were seeing it go above that limit. Then we downloaded the heap, and investigated it.
Tell me if you can spot the issue in the flame graph:
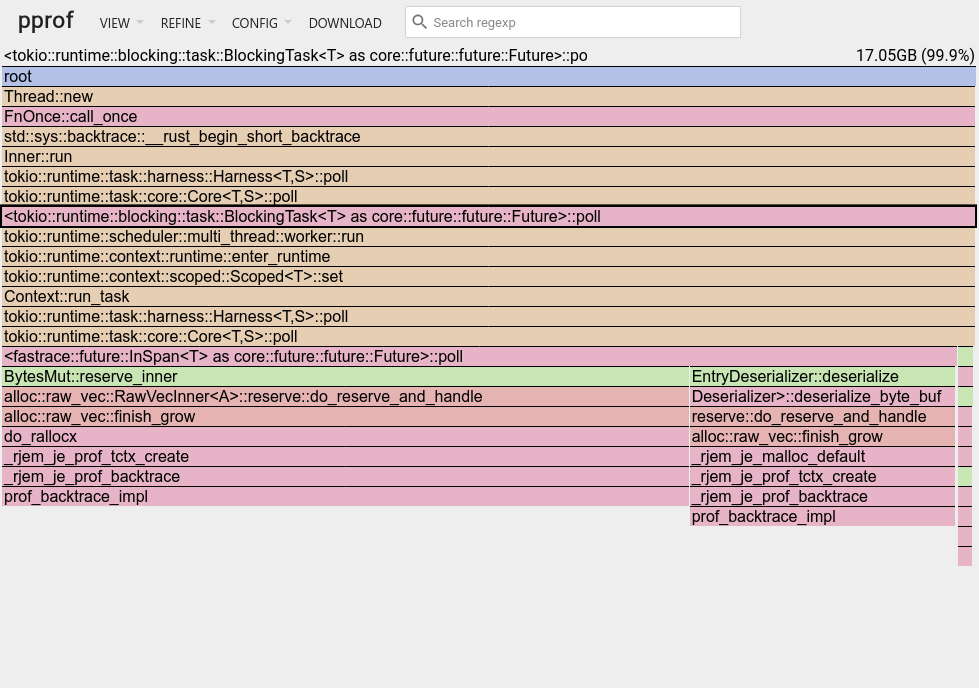
What this profile is showing us is a couple of things: about 2/3 come from our cache fetch implementation using BytesMut, and the other comes from re-hydrated values from the foyer disk cache.
No memory leaks it seems. However: the amount of bytes that our heap has in total is 17GB which is almost twice the amount of memory we have configured in the cache.
BytesMut and Vec
When you use BytesMut::with_capacity, this uses Vec as a backing store:
pub fn with_capacity(capacity: usize) -> BytesMut {
    BytesMut::from_vec(Vec::with_capacity(capacity))
}
Within Vec, there are two lengths. There is the len() which is how many initialised values it has. Then there is capacity(), which is how much it's asked the allocator for. Normally this capacity() is expanded as a power of two when adding values and is always greater than or equal to the length of entries. This can mean the in-memory size is not always what you'd expect.
So we have two lengths to consider: len() and capacity(), but only capacity() gives a more accurate account of memory usage.
Bytes and capacity()
There is no capacity() method on Bytes, given that its backing could be a number of different implementations. This isn't great for our use case here, where we want to account for the memory usage more accurately.
Changing To Vec<u8>
Since we can't use capacity() on Bytes, one troubleshooting step was that we tried using Vec directly. This won't give us cheaply cloneable bytes, but it will at least allow us to verify that this is where the extra memory usage comes from.
So we have a cache implementation like:
struct ByteCacheAppState {
    write_cache: HybridCache<CacheKey, Vec<u8>>,
}
With a weighter like:
...
.with_weighter(|key, value| key.memory_size() + value.capacity())
...
The New Profile
OK, running again with a 10GB limit, let's have a look at the new flame graph profile:
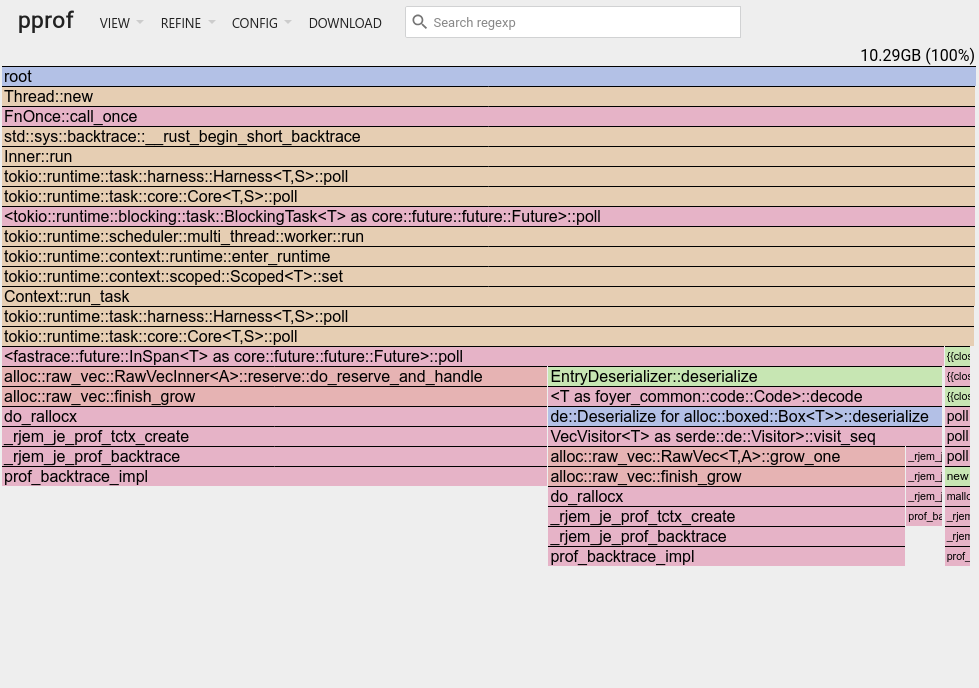
OK, that looks a lot better!
The Actual Bug
So it looks like the difference between len() and capacity() is our culprit. We can use this implementation, or use another struct that allows us to read actual capacity.
Problem solved right? However, this is a tale of two lengths!
Vec::with_capacity
After a bit of digging into the way allocating works on a Vec, if you create a Vec with a given capacity, it shouldn't reallocate until the length is greater than the initial capacity, even if it's not a power of two. Within our fetch() method we are setting the capacity explicitly, so we should only allocate once per cache entry, and not reallocate.
In the documentation it's implicitly stated that with_capacity does not guarantee that capacity() and len() will be equal, i.e, even in the given the example it's written so:
let mut vec = Vec::with_capacity(10);

assert_eq!(vec.len(), 0);
assert!(vec.capacity() >= 10);
Here that sneaky little >= sign indicates that the capacity does not have to be equal to the value given by with_capacity.
But, in practice currently, if you use with_capacity it will ask the allocator for that exact amount and won't reallocate until there are more entries than the initial capacity:
let mut vec = Vec::with_capacity(10);

assert_eq!(vec.len(), 0);
assert_eq!(vec.capacity(), 10);

for i in 0..10 {
    vec.push(i);
}

assert_eq!(vec.len(), 10);
assert_eq!(vec.capacity(), 10);
This brings us back to our initial implementation:
let mut buffer = BytesMut::with_capacity(byte_len);

while let Some(bytes) = req.stream.try_next().await? {
    buffer.extend_from_slice(&bytes);
}
We should only be allocating once during the call to with_capacity. Both len() and capacity() should be equal and equal to our given capacity byte_len. Why are they not equal and why does it, looking at the heap profile, look like there is a reallocation happening?
Inclusive and Exclusive Ranges
We're using standard HTTP Range requests for requesting byte ranges. In rust parlance, they are Inclusive Ranges. I.e,
start..=endInstead of Exclusive ranges. I.e, the standard Range
start..endAnd essentially everything in rust is expecting a Range instead of RangeInclusive. But when making http range requests we need to convert the other way.
And so to go from exclusive to inclusive:
let start = range.start();
let end = range.end() - 1;

let inclusive = start..=end;
And to go from inclusive to exclusive:
let start = range.start();
let end = range.end() + 1;

let exclusive = start..end;
Cache Keys and Inclusive Ranges
Our CacheKey implementation, we store the start & end as an exclusive range.
fn to_cache_key(path: &str, range: RangeInclusive<usize>) -> CacheKey {
    CacheKey {
        path: path.to_string(),
        start: range.start(),
        end: range.end() - 1,
    }
}
Then we use this cache key to ask how much we should allocate:
let byte_len = cache_key.end - cache_key.start;Then in our backing request to our object storage, we were converting it back into an inclusive range by:
let range = RangeRequest {
    start: cache_key.start,
    end: cache_key.end + 1
};
Can you spot the issue with the code above?
What is wrong with our implementation here?
If you go back and re-read how to convert from range to the other, you might catch it.
That's right: the conversion in the above code is backwards. We were converting it the wrong way! The byte_len was always two bytes short. Meaning that the BytesMut would always reallocate.
To make matters worse: even though our byte_len was not the right length, the two errors cancelled eachother out. We ended up inadvertently sending the correct request to the object store, our downstream services got the byte ranges they wanted, and the bug went undetected. That is, until we reach our assigned memory limits...
Adding some debug assertions in the code it was easy to make our existing tests fail when they ran:
let mut buffer = BytesMut::with_capacity(byte_len);

while let Some(bytes) = req.stream.try_next().await? {
    buffer.extend_from_slice(&bytes);
}

debug_assert_eq!(bytes.len(), byte_len);
debug_assert_eq!(bytes.capacity(), byte_len);
The Fix
So the fix in the end was simple: do a proper inclusive/exclusive conversion, which would mean that we only allocate as much as we need.
Converting to the exclusive range cache key:
fn to_cache_key(path: &str, range: RangeInclusive<usize>) -> CacheKey {
    CacheKey {
        path: path.to_string(),
        start: range.start(),
        end: range.end() + 1,
    }
}
Converting back to the inclusive range request:
let range = RangeRequest {
    start: cache_key.start,
    end: cache_key.end - 1
};
With this in place, everything worked without having to stop using Bytes, and preventing further deep changes.
Conclusions & Thoughts
While rust is great at managing memory for you, there are situations where you need to keep a close eye on how much memory is being used. A cache service is a great example of that.
What would have been great from the start of the language, and definitely too late to change now, would be designing some of the standard library with fallible allocations from the get go. If we had an API shaped for that, we would be able to catch errors like this much easier. Yes there are now methods like try_reserve on Vec, but downstream abstractions like BytesMut do not have the same methods. Thinking this through: for a language that prides itself on explicit behaviour, this feels like one area where it could be less implicit.
In fairness, there could be more structure in place in the cache implementation to prevent this sort of bug from appearing, like using types more strongly to represent ranges etc.. If nothing else, it goes to show that sometimes bugs can be deceptively simple to fix, and having the tools to profile applications is vitally important.